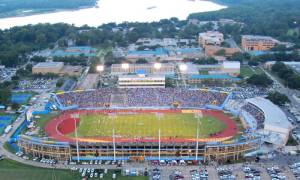
The 2015 football attendance numbers are in, and once again, HBCUs held it down. HBCUs represented nearly one-third of the top thirty attendances averages at the FCS level and held down seven of the top 30 spots in Division II.
Southern took home the crown for the highest attendance overall, averaging 18,310 fans per game, good for eighth in the country. They were joined in the top 30 by fellow SWAC schools Jackson State, Alcorn State, Alabama State and rival Grambling.
Tuskegee did even better in terms of Division II average, as their 10,663 fans per game finished second in the nation. Fellow SIAC schools Albany State, Morehouse, and Fort Valley State also finished in the top 30.
The SWAC and the SIAC once again finished as the top conferences in the FCS and Division II levels. The SWAC led the FCS with 12,823 fans per game while The SIAC led Division II with an average of 6,074.
As is usually the case, the MEAC and CIAA weren’t as strong as their southern counterparts, but they both had their bright spots.
The MEAC took home spots 10 through 12 in the FCS with South Carolina State, FAMU and North Carolina A&T having strong showings. The MEAC finished sixth in the FCS with 8,937 fans per contest.
The CIAA finished fifth in Division II attendance, averaging 3,162 fans per game. Virginia Union, Winston-Salem State and Livingstone all finished in the top 30.
FCS Top 30
8. Southern (18,310)
10. SC State (15,629)
11. FAMU (15,060)
12. NC A&T (14,988)
14. TSU (14,620)
15. Jackson State (13,252)
18. Alcorn State (12,343)
24. ASU (10,290)
28. Grambling (10,035)
D2 Top 30
2. Tuskegee (10,663)
6. Albany St. (7,432)
10. Virginia Union (6,625)
11. Morehouse (6,509)
13. Winston-Salem State (6,068)
15. Fort Valley St. (6,047)
22. Livingstone (5,018)
Overall HBCU numbers:
1. Southern (18,310)
2. SC State (15,629)
3. FAMU (15,060)
4. NC A&T 14,988)
5. TSU 14,620
6. Jackson State 13,252
7. Alcorn State 12,343
8. Tuskegee 10,663
9. ASU 10,290
10. Grambling 10,035
11. Norfolk State 8,204
12. Albany State 7,432
13. Bethune-Cookman 7,160
14. Texas Southern 7,075
15. Alabama A&M 6,843
16. Virginia Union 6, 225
17. UAPB 6,573
18. Morehouse 6,509
19. Winston-Salem State 6,068
20. Fort Valley State 6,047
21. North Carolina Central 5,497
22. Livingstone 5,018
23. Prairie View 4,622
24. Benedict 4,281
25. Hampton 4,246
26. Savannah St. 4,042
27. Virginia State 3,763
28. Clark Atlanta 3,680
29. Stillman 3,584
30. Elizabeth City State 3,441
31. Howard 3,405
32. Kentucky State 3,284
33. Morgan State 3,101
34. Mississippi Valley State 3,162
35. Bowie State 2,359
36. Delaware State 2,435
37. Johnson C. Smith 2,241
38. Miles 2,016
39. Lincoln (MO) 1,942
40. Fayetteville State 1,650
41. Shaw 1,583
42. St. Aug 1,583
43. Lincoln (PA) 1,316
44. Lane 1,083
45. Cheyney 783
