Not much of an explaination needed for this one. We’re keeping track of the attendance for homecoming games across HBCU football. All numbers below were taken from official boxscores from the respected homecoming squad.
The numbers will be updated as the remaining teams play their homecoming games.
[inArticle]
MEAC
Florida A&M – 25,679
NC A&T – 21,500
Norfolk State – 20,178
North Carolina Central – 12,319
Bethune-Cookman- 12,204
South Carolina State -12,121
Morgan State – 8,762
Howard – 7,532
Delaware State – 4,142
CIAA
Virginia State – 14,872
Winston-Salem State – 11,740
Virginia Union – 8,012
Johnson C. Smith – 5,388
Fayetteville State – 5,327
Bowie State – 4,114
Elizabeth City State – 4,000
Livingstone – 2,964
St. Augustine’s – 2,500
Lincoln- 1,869
Shaw – N/A
SWAC
Jackson State – 35,013
Southern – 20,344
Alcorn State – 17,593
Alabama A&M – 14,626
Grambling State – 14,562
Prairie View – 13,626
Texas Southern – 8,300
UAPB – 7,600
Mississippi Valley State – 3,289
Alabama State – Nov. 28
SIAC
Morehouse – 25,911
Tuskegee – 23,001
Miles – 11,819
Kentucky State – 9,900
Benedict – 9,383
Savannah State – 8,101
Central State – 4,361
Lane – 2,975
Clark Atlanta – 1,300
Tuskegee – Nov. 9
Other

Tennessee State – 16,389
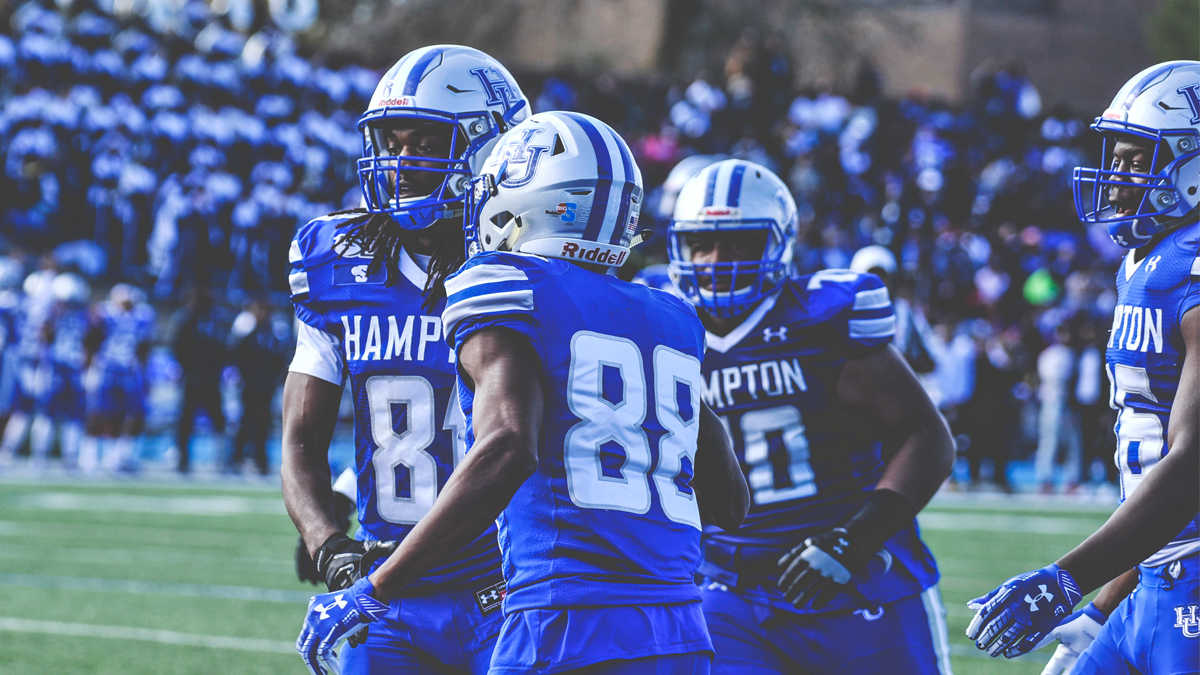
Hampton – 15,000
Edward Waters – 4,629
West Virginia State – 3,929
Lincoln (MO) – 2,130
Langston – 0
Allen University: N/A
[inArticle]
