 |
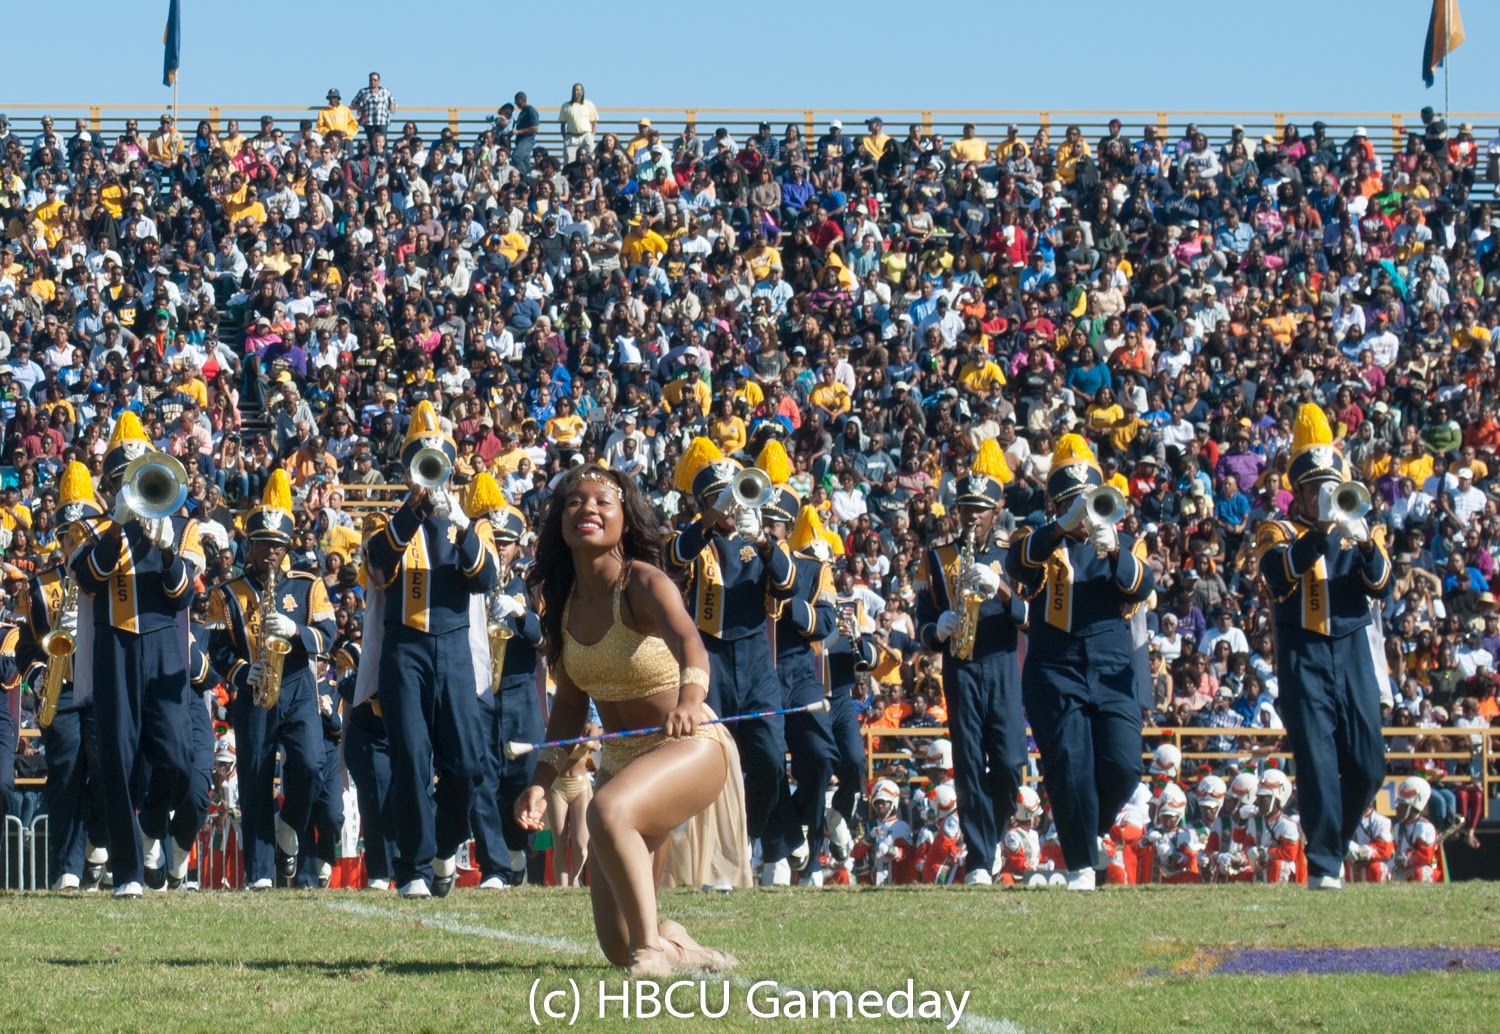
| North Carolina A&T had the highest attended homecoming game on the East Coast in 2014. |
By Steven J. Gaither
Now that there are now more home games for the remaining HBCUs in college football, we’re taking a look back at the season. Homecoming is pretty much the biggest game for all HBCUs, so we figured we’d check the stats.
Based off the attendance numbers posted in football box scores, Tuskegee edged out Tennessee State for the highest attended HBCU homecoming of 2014. More than 31,000 filed into Cleve Abbott Stadium while TSU packed just under 30k into LP Field. The smallest number we were able to find was 869 reported by Livingstone College against Bowie State.
Seven schools recorded more than 20,000 fans, and three of those (Jackson State, Southern and Alabama A&M) hail from the SWAC.
 |
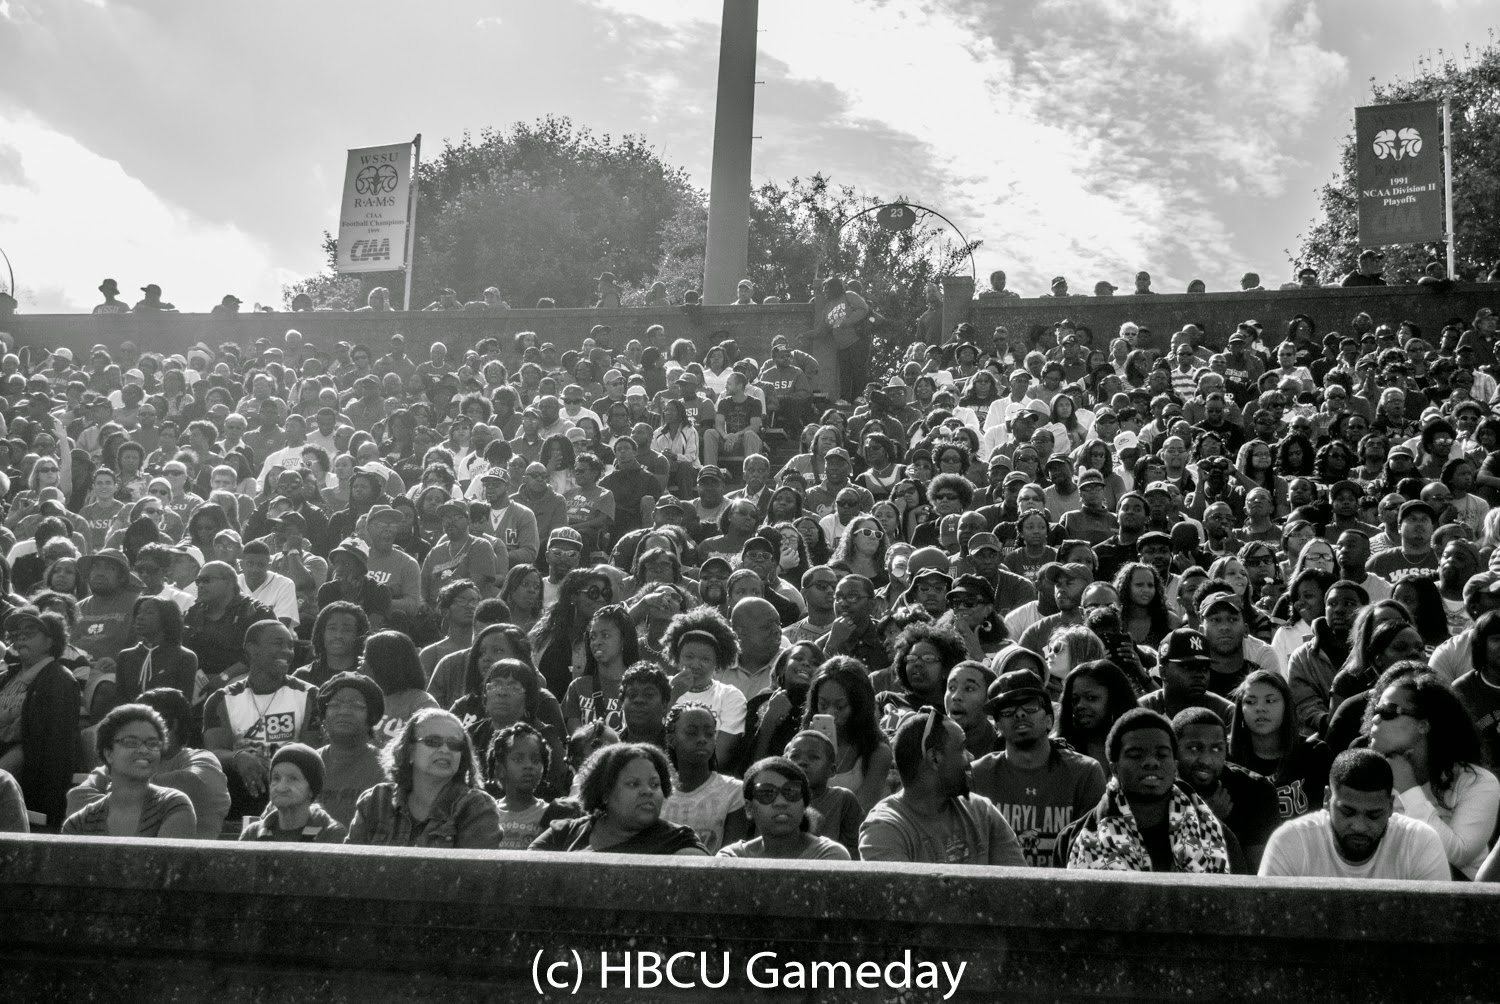
| WSSU’s 16,555 attendees doubled its next CIAA competitor. |
CIAA
Bowie State (vs. Virginia State) 3,317
Elizabeth City State (vs. Chowan) 4,967
Fayetteville State (vs. Livingstone) 3,133
Johnson C. Smith (vs. St. Augustine’s): 1,225
Lincoln (vs. Elizabeth City State): 2,100
Livingstone (vs. Bowie State): 869
Shaw (vs. Johnson C. Smith): 6,587
St. Augustine’s (vs. Livingstone) 3,221
Virginia State (vs. Lincoln) 3,270
Winston-Salem State (vs. St. Aug): 16,555
 |
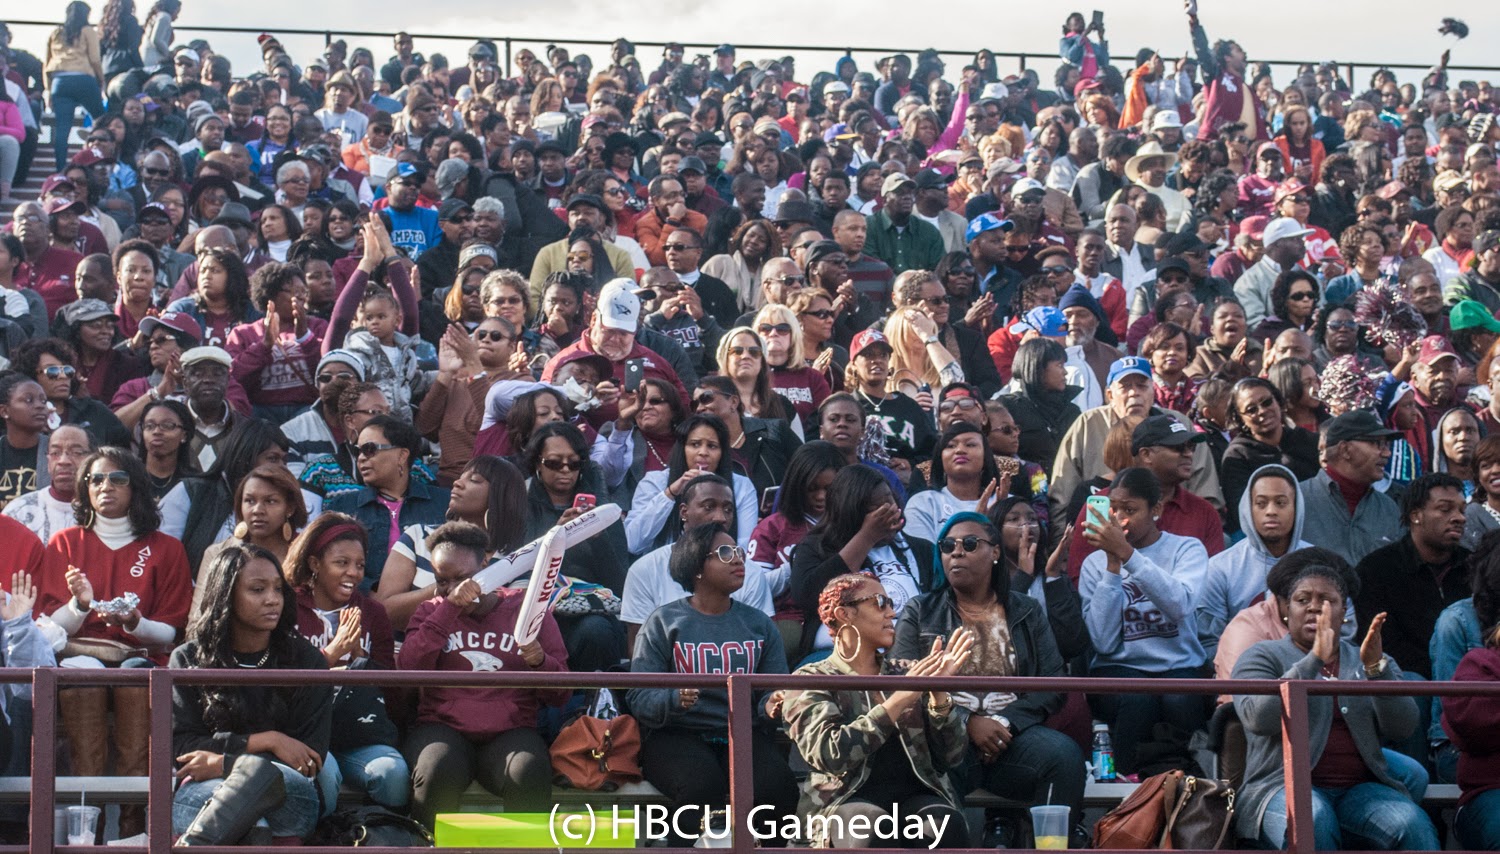
| NCCU ranked third in homecoming attendance among MEAC schools. |
MEAC
Bethune-Cookman (vs. Howard): 10,247
Delaware State (vs. NC A&T): 6,237
Florida A&M (vs. Norfolk State): 18,663
Hampton (vs. Morgan State): 8,000
Howard (vs. FAMU): 7,062
Morgan State (vs. NCCU): 9,420
Norfolk State (vs. DSU): 11,260
North Carolina A&T (vs. FAMU): 21,500
North Carolina Central (vs. Hampton): 11,964
Savannah State (vs. Norfolk State) 5,268
South Carolina State (vs. Savannah State): 10,013
SIAC
Albany State (vs. Clark Atlanta): 9,736
Benedict (vs. Morehouse): 8,749
Central State (vs. Concordia): 3,692
Clark Atlanta (vs. Paine) 23,591
Fort Valley State (vs. Paine): 15,042
Kentucky State (vs. Miles College): 6,982
Paine (vs. Edward Waters): 1,346
Miles (vs. Central State): 10,045
Morehouse (Albany State): 11,234
Tuskegee (vs. Kentucky State) 31,756
SWAC
Alabama A&M (vs. Grambling State): 21,254
Alabama State (vs. Stillman): 13,156
Alcorn State (vs. Texas Southern): 15,513
Arkansas-Pine Bluff (vs. Prairie View): 12,337
Grambling State (vs. UAPB): 10,000
Mississippi Valley State (vs. Prairie View); 7,829
Jackson State (vs. Mississippi Valley): 21,078
Prairie View (vs. Alabama State): 6,257
Southern (vs. UAPB): 23,091
Texas Southern (vs. UAPB): 8,210
OTHER
Tennessee State (vs. FAMU): 29,225
Cheyney (vs. Lock Haven): 3,281
Lincoln (MO) (vs. Texas College): 4,136
