CIAA
Winston-Salem State 15,213 (vs. Shaw)
Livingstone 9,543 (vs. Fayetteville State)
Virginia Union 8,214 (vs. Chowan)
Virginia State 7,003 (vs. Bowie State)
Johnson C. Smith 4,517 (vs. Shaw)
Shaw 4,186 (vs. St. Aug)
Elizabeth City State 4,176 (vs. Lincoln)
Fayetteville State 4,111 (vs. St. Aug)
Bowie State 3,749 (vs. Chowan)
St. Aug 2,500 (vs. JCSU)
Lincoln 1,200 (vs. Virginia Union)
SIAC
Tuskegee 28,765 (vs. Miles)
Morehouse 14,443 (vs. Benedict)
Fort Valley State 11,345 (vs. Morehouse)
Albany State 10,734 (vs. Morehouse)
Benedict 7,894 (vs. Clark Atlanta)
Kentucky State 6,943 (vs. Fort Valley)
Clark Atlanta 6,934 (vs. Albany State)
Central State 6,473 (vs. Miles)
Stillman 5,276 (vs. Lane)
Miles 4,117 (vs. Kentucky State)
Lane College 2,185 (vs. Central State)
Other
Tennessee State 22,144 (vs. Eastern Illinois)
Lincoln (MO) 4,327 (vs. Missouri S&T)
Edward Waters (N/A)
 |
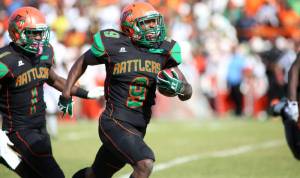
| (FAMU photo) |
MEAC
Florida A&M 22,678 (vs. Delaware State)
North Carolina A&T 21,500 (vs. Howard)
South Carolina State 19,821 (vs. Hampton)
Norfolk State 15,123 (vs. Savannah State)
North Carolina Central 11,965 (vs. Norfolk State)
Bethune-Cookman 9,875 (vs. Norfolk State)
Morgan State 7,749 (vs. Hampton)
Hampton 7,010 (vs. Delaware State)
Howard 6,088 (vs. Norfolk State)
Savannah State 5,649 (vs. North Carolina Central)
Delaware State 5.388 (vs. South Carolina State)
SWAC
Alcorn State 30,129 (vs. Grambling State)
Southern 23,112 (vs. Prairie View)
Jackson State 17,501 (vs. UAPB)
Alabama State 15,201 (vs. Miles)
Alabama A&M 13,674 (vs. UAPB)
UAPB 11,437 (vs. Grambling)
Grambling State 10,536 (vs. Mississippi Valley)
Texas Southern 10,127 (vs. Southern)
Prairie View 7,113 (vs. Mississippi Valley)
Mississippi Valley 4,295 (vs. Texas Southern)


